I am new to these graphs in general and I am trying to understand how the graphs correlate to the actual brush.
Does the line represent part of the profile of a cross section of the brush stroke?
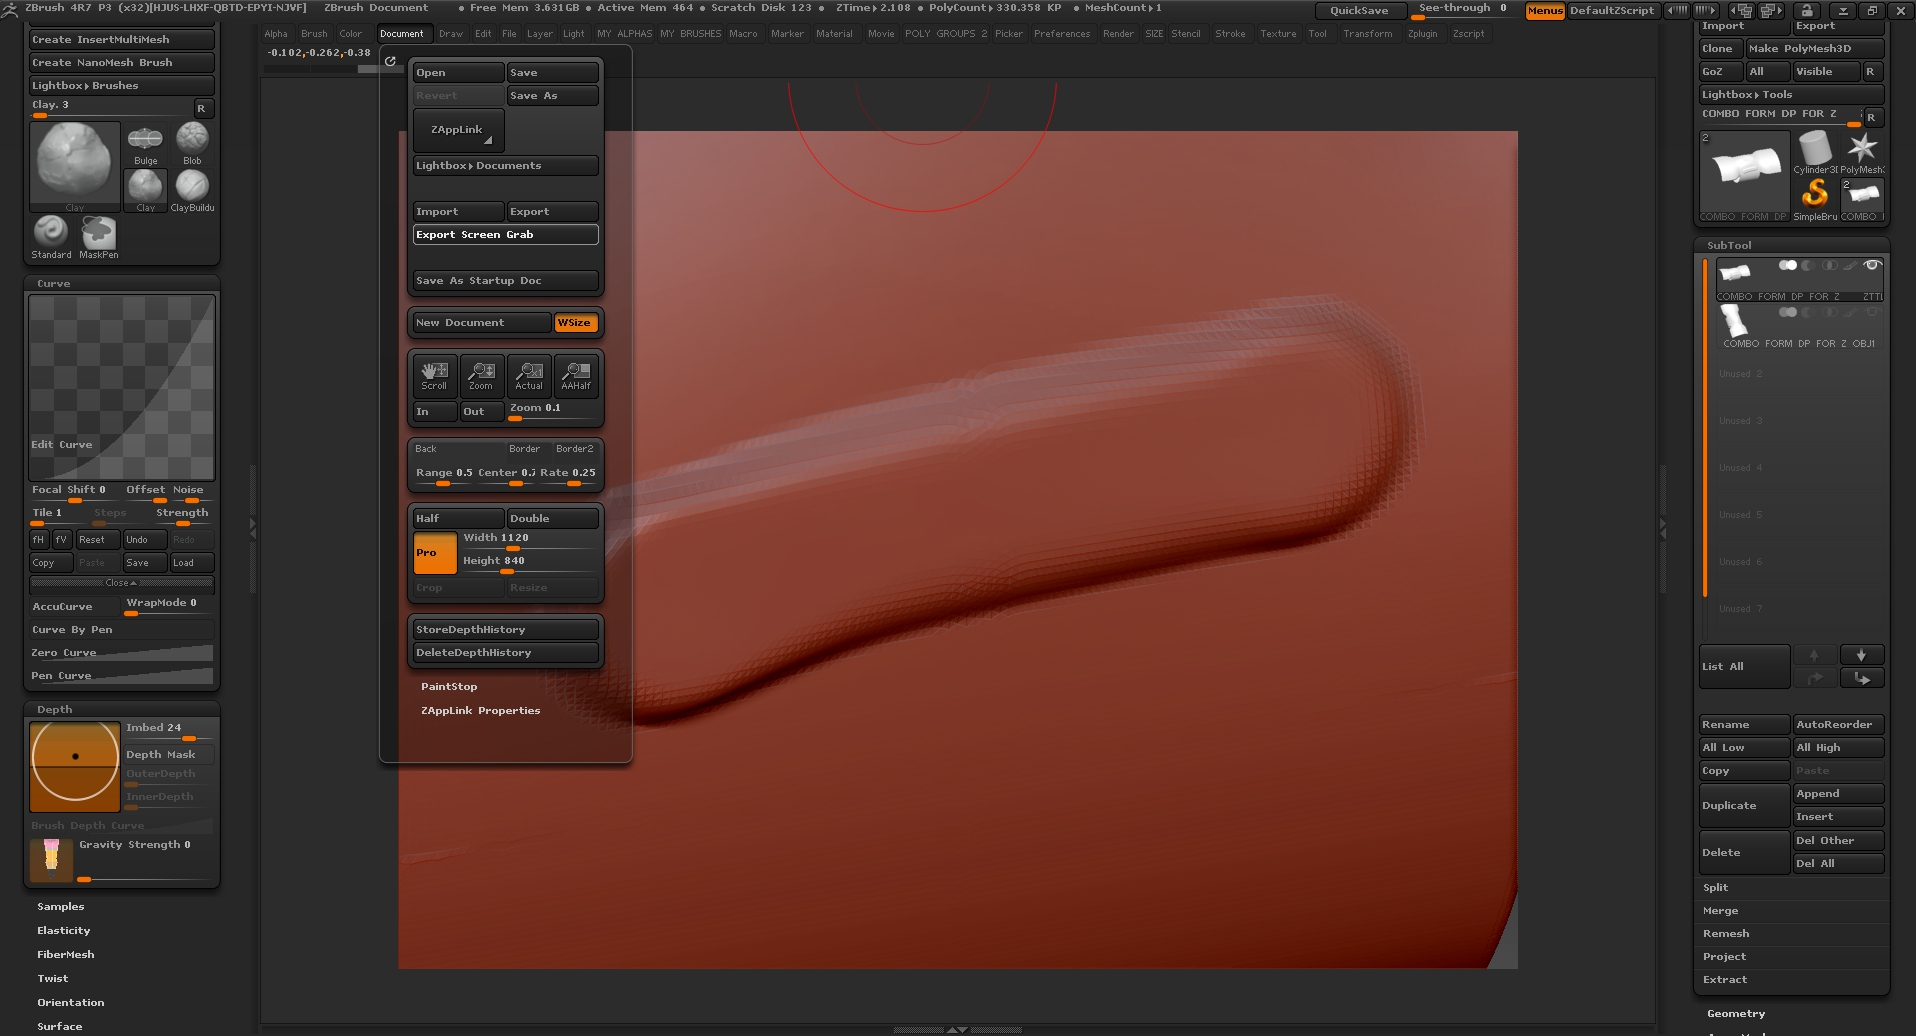
At first I thought it was that but in this example I don’t see that? This is the clay brush and its default graph.
Also do different types of modifier graphs prepresent different data along their x and y axis ? if so where can I find that info?
Thanks
Attachments